
Against a backdrop of dramatic recovery in the U.S. currency’s value relative to a basket of currencies, the EUR/USD dropped on Tuesday. This type of volatility spikes and disruption of the technical picture in the next few days may be triggered by the low liquidity of this post-holiday market.
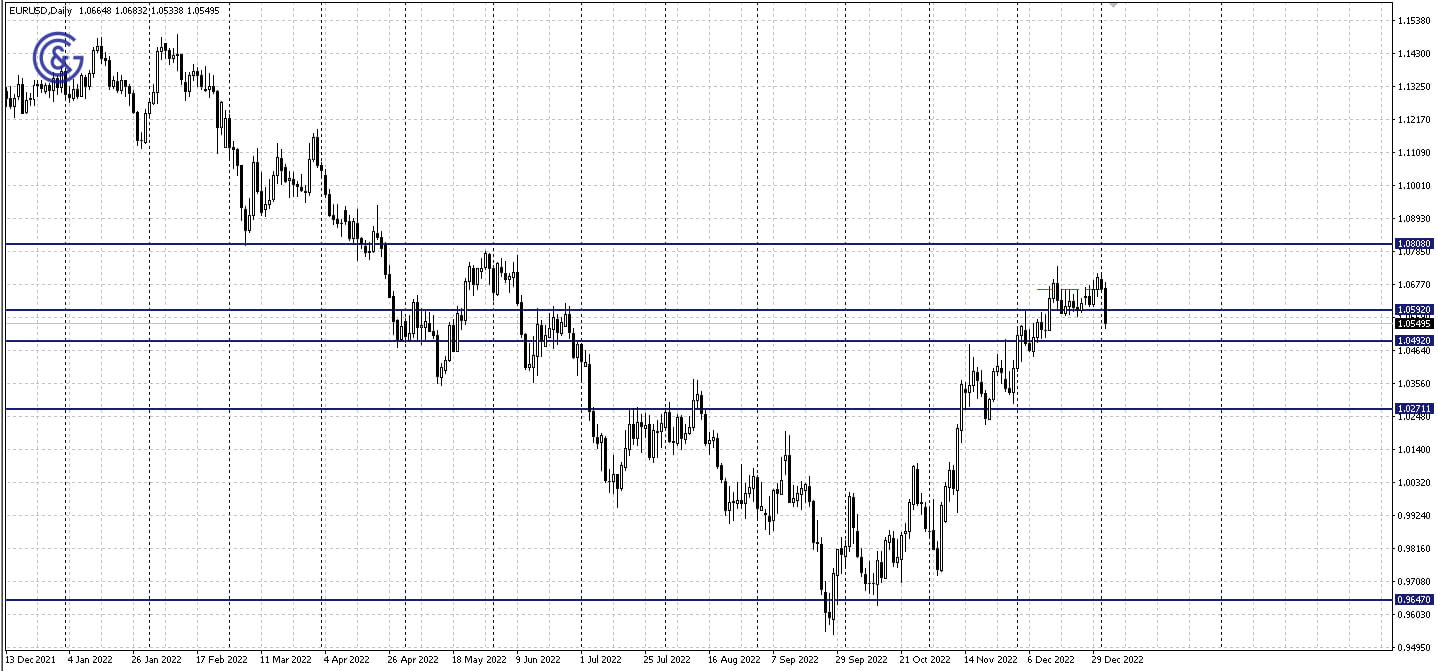
On the daily chart, the EUR/USD pair has broken out the 1.0592 support level and is headed toward the next target at 1.0492. If this level fails to stop the price, it may keep falling to the 1.0350 area.
On Tuesday, the release of the inflation rate in Germany for the month of December may have a certain impact on the volatility of the euro at 1:00 PM GMT. The Consumer Price Index is projected at -0.3% on a monthly basis against the previous -0.5% m/m. On a year-on-year basis, the figures may decline from 10.0% to 9.1%.
The Manufacturing PMI in the United States for the month of December will be published at 2:45 PM GMT. The anticipated figure is 46.2 as compared to 47.7 in the previous period. Should the actual values be significantly higher or lower than expected, the volatility of the dollar may intensify.
The major fundamental events that will affect the U.S. dollar’s volatility this week will be the release of the FOMC minutes on Wednesday at 7:00 PM GMT and the U.S. employment report at 1:30 PM GMT on Friday.
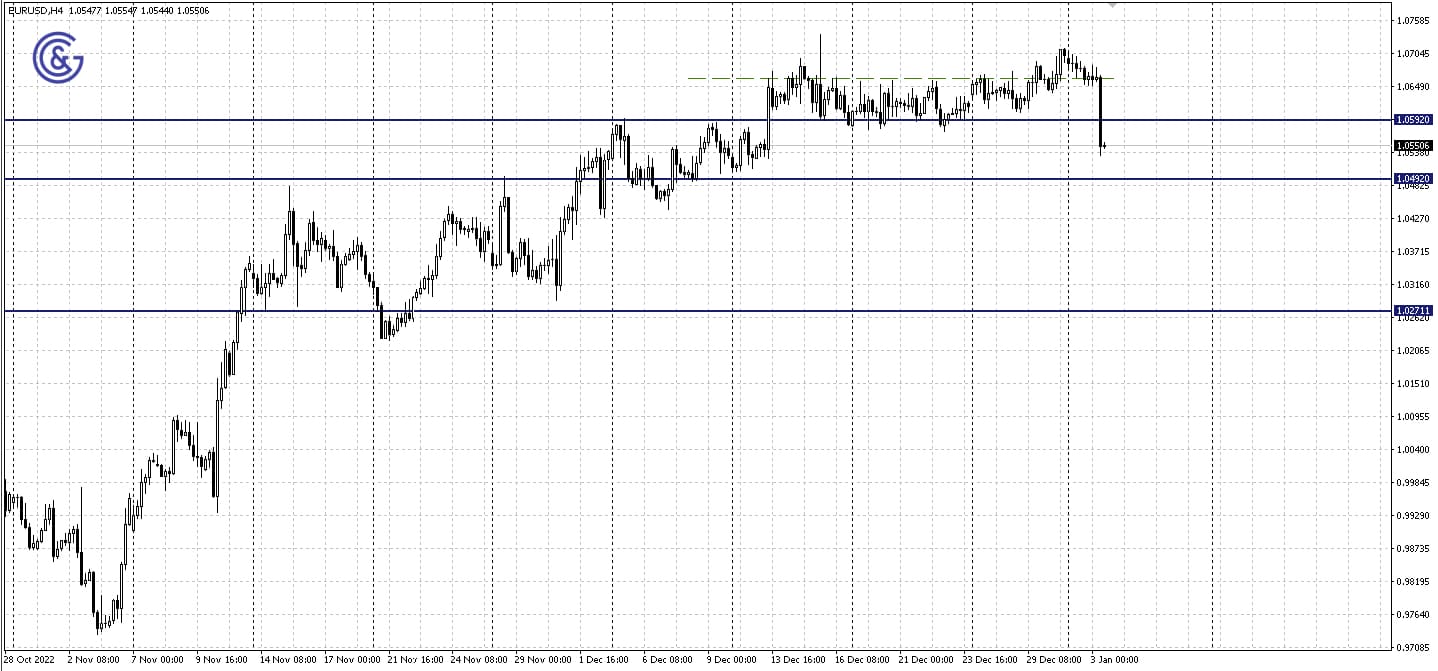
On the 4H chart of the EUR/USD pair, we can see that the pair still has sufficient range to move toward the support of the 1.0492 - 1.0592 corridor. Both a reversal upward and a further decline are likely once it is reached.
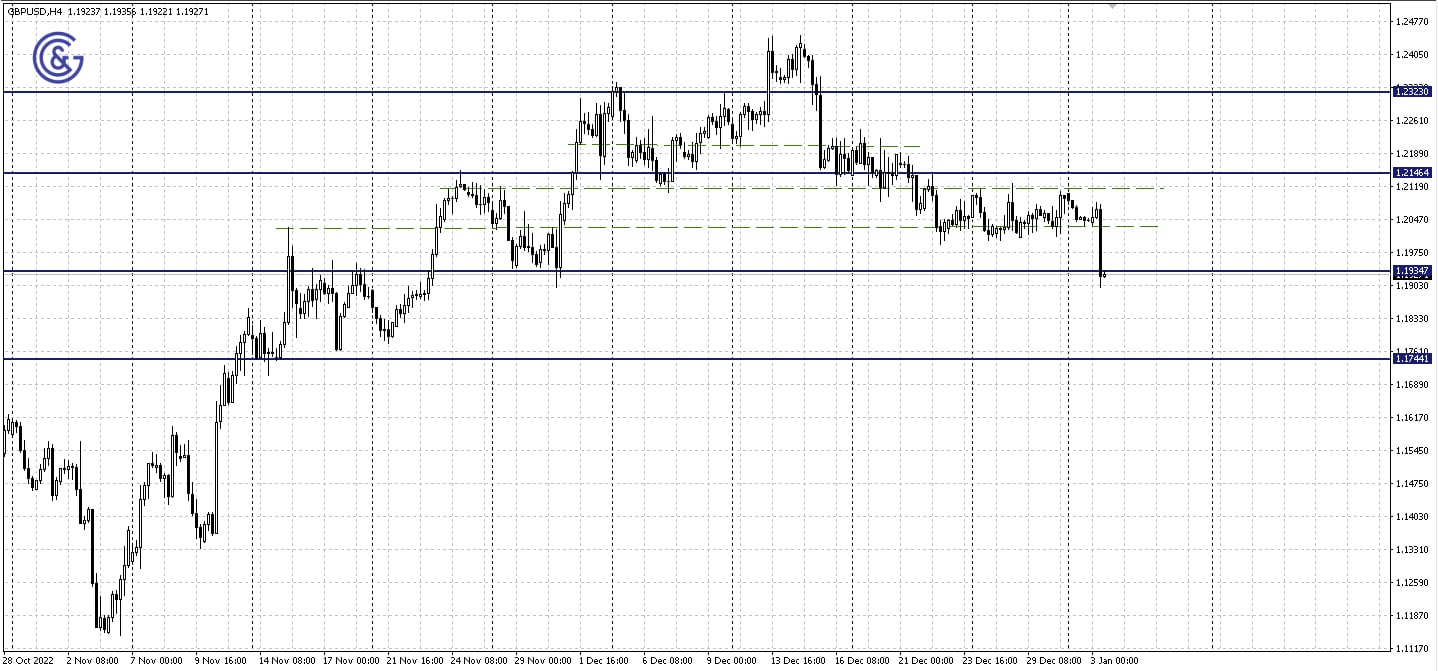
The GBP/USD pair is also trading under pressure from the increasing U.S. dollar on Tuesday. The U.S. macroeconomic figures will be the main focus of investors this week. Essentially, this is what makes the dollar the key driver of the pair's dynamics.
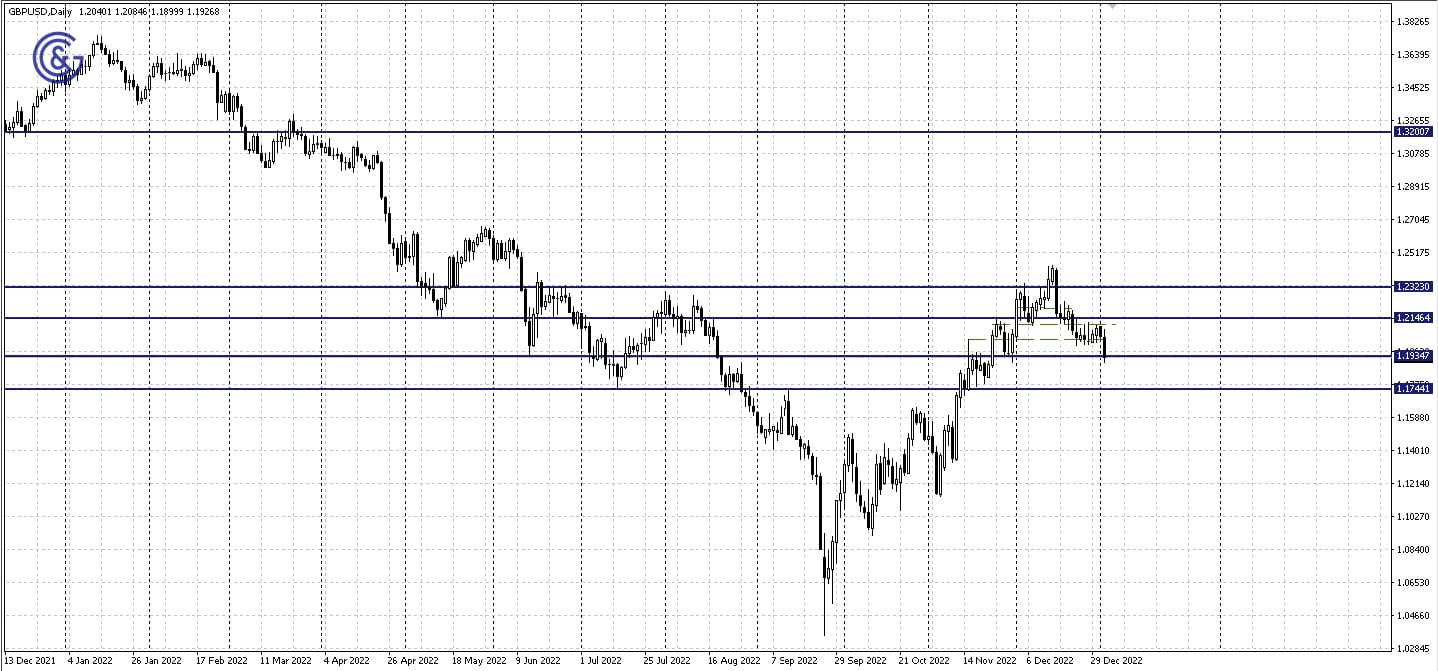
On the GBP/USD daily chart, the strength of the support level of the 1.1934 - 1.2146 sideways range is clearly being tested. Breakout may turn out to be false. That being said, if there is a consolidation below 1.1934, the 1.1744 support can be the next target to the south.
The Manufacturing PMI in the United States for the month of December will be published at 2:45 PM GMT. The anticipated figure is 46.2 as compared to 47.7 in the previous period. Should the actual values be significantly higher or lower than expected, the volatility may intensify locally.
The major fundamental events that will affect the U.S. dollar’s volatility this week will be the release of the FOMC minutes on Wednesday at 7:00 PM GMT and the U.S. employment report at 1:30 PM GMT on Friday.
On the 4H chart of the GBP/USD pair, we can see the prerequisites of a true breakout of the 1.1934 support. This opens the way for the currency pair to move to the next target at 1.1744.
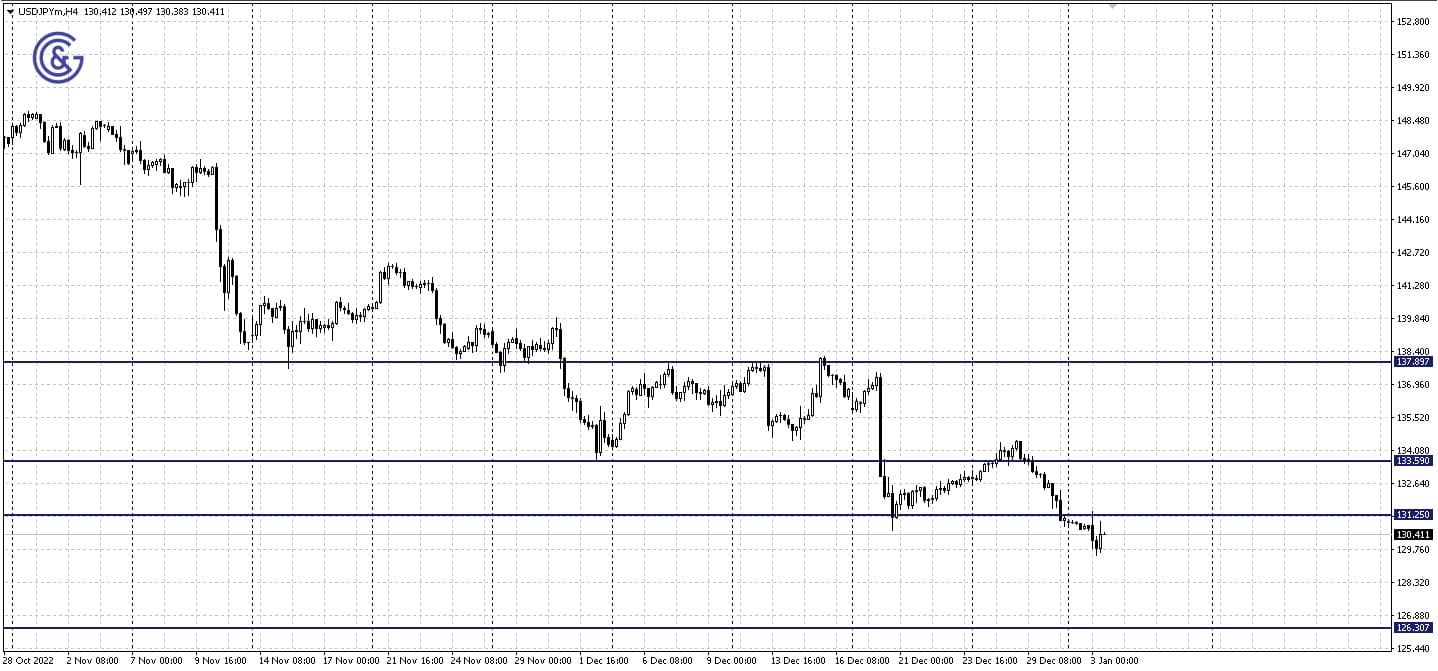
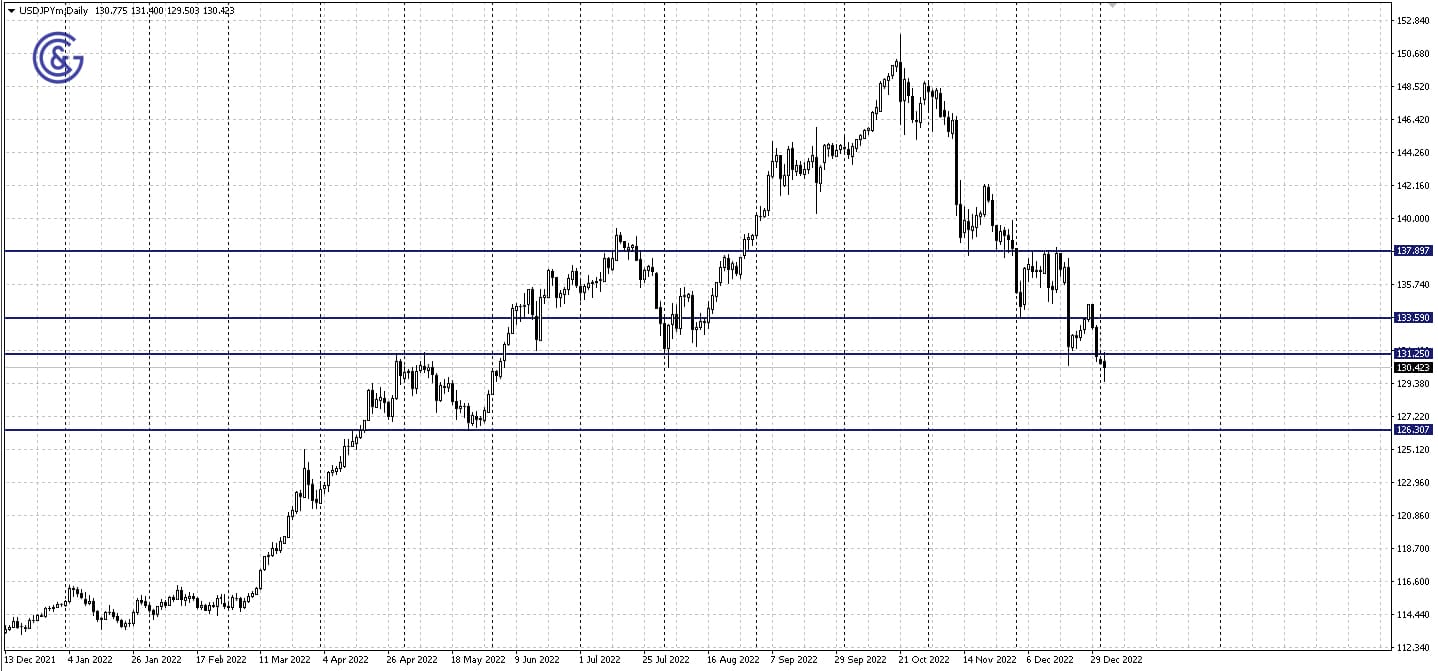
The Japanese yen keeps getting stronger this week after the market players took the Bank of Japan’s yield control policy change in December as a hint that the latter would abandon its super soft monetary policy.
On the USD/JPY daily chart, we are seeing the breakout of the 131.25 support level and consolidation below it. This basically opens the way for quotes to the next target to the south at 126.30.
Aside from the yen’s sensitivity to the market players’ expectations, the USD/JPY pair will be affected by the response of the U.S. dollar to macroeconomic figures in the coming days.
The Manufacturing PMI in the United States for the month of December is expected at 2:45 PM GMT. The anticipated figure is 46.2 as compared to 47.7 in the previous period.
The major fundamental events that will affect the U.S. dollar’s volatility this week will be the release of the FOMC minutes on Wednesday at 7:00 PM GMT and the U.S. employment report at 1:30 PM GMT on Friday.
On the 4H chart of the USD/JPY pair, we see that a portion of the currency pair's losses was compensated. Following a drop, the quotes pulled back to the 131.25 level that was previously broken out. The weakening may continue if the level is confirmed as resistance by a downward bounce.