One of the trend continuation patterns is the so-called cup and handle chart pattern. The fact that its shape visually resembles the coffee cup is how this pattern got its peculiar name. When you are performing technical analysis, the cup and handle pattern gives a clue about the continuation of a long-term uptrend in the market.
Below, we shall talk about how to identify it in the chart and determine the algorithm for position entry.
1. Cup and Handle: What Does It Look Like
2. Cup and Handle Chart Pattern: Formation Criteria
3. How to Trade Cup and Handle Pattern
Cup and handle is a technical chart pattern in forex and stock market. It takes from several months to a year to form, and its emergence means that the uptrend will continue.
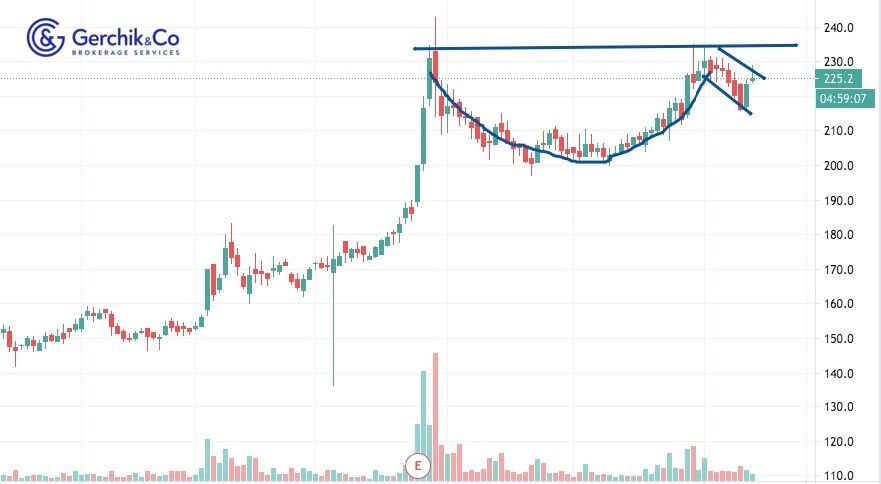
This pattern looks like a semicircular line of a descending trend correction, at the two top points of which we can draw a resistance level. The price “draws” one more small corrective movement from the second point. The cup and handle is a technical chart pattern signaling that it’s time to open a long position.
.jpg)
In order to establish that what you see in the chart is indeed a cup and handle and not just a similarly-looking pattern, it is important for all the formation criteria listed below to be observed:

1. Draw the resistance line along the two ends of the cup.
2. Breakout of this level signals that you should go long.
3. You can open a position when the level gets broken out and place the stop-loss order behind the high of the candlestick which breaks out the level. This is an aggressive approach.
4. It’s best to enter a position at the price bounce when the price confirms the resistance level that has been broken out as support. This is a conservative approach. Stop loss is placed behind the low of the rollback.
5. The cup and handle pattern allows earning profit equal to the “depth” of the cup.
You may sometimes come across an inverted cup and handle patterns in the market. This type of C&H pattern points to a continuation of the downtrend. The rules for its identification and position entry are similar to those described above, except that it is done in the opposite fashion.
Wish to learn how to read charts like a pro?
Download tutorial app for free